Spreadsheet Ready Break Even Analysis for Small Businesses

Break-even point (BEP) is the sales level, in units or in pounds, at which total revenue exactly covers total costs, leaving zero profit and zero loss. It’s calculated from your contribution margin, which is why it’s such a direct tool for pricing decisions, cost control, and planning ahead. As the FSB explains, it works for both product and service businesses, and once you’ve run it once, updating it takes minutes.
TL;DR:
A realistic owner salary should be included in fixed costs to accurately estimate the break-even point.
Changes in price or fixed costs can significantly reduce or increase required sales to break even, so run scenarios before making decisions.
A margin of safety under 15 to 20 percent indicates high risk, meaning small sales declines could cause losses.
Proper separation of fixed, semi-variable, and variable costs ensures the break-even calculation remains meaningful within relevant volume ranges.
Regularly updating and testing the break-even model monthly helps prevent misjudging profitability and cash flow shortfalls.
Table of Contents
What break-even analysis measures for a small business
Break-even analysis strips your finances down to two categories: fixed costs and variable costs. Fixed costs stay roughly constant regardless of sales, things like rent, insurance, and your accounting subscription. Variable costs move with volume, such as raw materials, packaging, or the delivery fee you pay per order.
The gap between your selling price and your variable cost per unit is your contribution margin, the amount each sale contributes towards fixed costs before you see any profit. Divide that figure by your selling price and you get the contribution margin ratio, expressed as a percentage. It’s the single most useful number for pricing conversations, because it tells you instantly how much of every pound in revenue is actually working for you.
BEP earns its keep in specific situations:
Setting a price for a new product before you’ve sold a single unit
Deciding whether a product launch is financially viable before you commit stock or marketing spend
Giving investors or a lender a defensible, transparent number rather than a guess
It’s less useful for day-to-day cash-flow timing or for businesses with wildly variable pricing across services, where a single average figure can mask what’s really happening deal by deal.
How to calculate break-even: formulas and a worked example
Two formulas cover almost every small business scenario. For product-based businesses, calculate break-even in units:
Break-even units = Fixed costs ÷ (Selling price − Variable cost per unit)
For service businesses or anyone selling at multiple price points, calculate break-even in revenue instead:
Break-even sales (£) = Fixed costs ÷ Contribution margin ratio
Both formulas trace back to the same contribution margin logic: fixed costs divided by whatever each sale contributes.
Here’s a worked example. Say you run a small candle-making business with monthly fixed costs of £2,400 (rent, insurance, your own modest salary). Each candle sells for £18 and costs £6 in wax, wicks, and packaging.
Contribution margin per unit = £18 − £6 = £12
Break-even units = £2,400 ÷ £12 = 200 candles per month
Break-even sales (£) = 200 × £18 = £3,600
A service business variant works the same way with revenue instead of units. A freelance bookkeeper with £1,800 in monthly fixed costs and a 60% contribution margin ratio needs £3,000 in monthly billings to break even (£1,800 ÷ 0.60).
To find units for a target profit, add the profit goal to fixed costs before dividing: (Fixed costs + Target profit) ÷ Contribution margin per unit. Wanting £1,000 profit on top of the candle business above means selling (£2,400 + £1,000) ÷ £12 = 283 candles.
Before you build this in a spreadsheet, get your inputs right:
Include a realistic owner salary in fixed costs, not zero
Exclude one-off launch costs unless you’re specifically modelling total cash need
Separate genuinely fixed costs from ones that step up at certain volumes
Pro Tip: Build your break-even formula in one Excel tab with fixed costs, price, and variable cost as separate input cells. Change any one number and watch the break-even units recalculate instantly, rather than rebuilding the sum from scratch every time your costs shift.
Break-even graph and margin of safety explained
A break-even chart plots three lines against units sold: fixed costs (flat), total costs (fixed plus variable, sloping upward), and revenue (sloping upward from zero). Where the revenue line crosses the total cost line is your break-even point, and everything below it, before that crossing, is loss territory.
To plot it in Excel or Sheets using the candle example, build a table with columns for units sold (0 to 400 in steps of 20), then calculate fixed costs, total costs, and revenue for each row. Select the three columns and insert a line chart. The intersection at 200 units confirms the formula.
Margin of safety measures how much your actual or forecast sales exceed break-even, and it’s the number that tells you how much room you have before losses start:
Margin of safety (£) = Actual sales − Break-even sales
Margin of safety (%) = Margin of safety (£) ÷ Actual sales
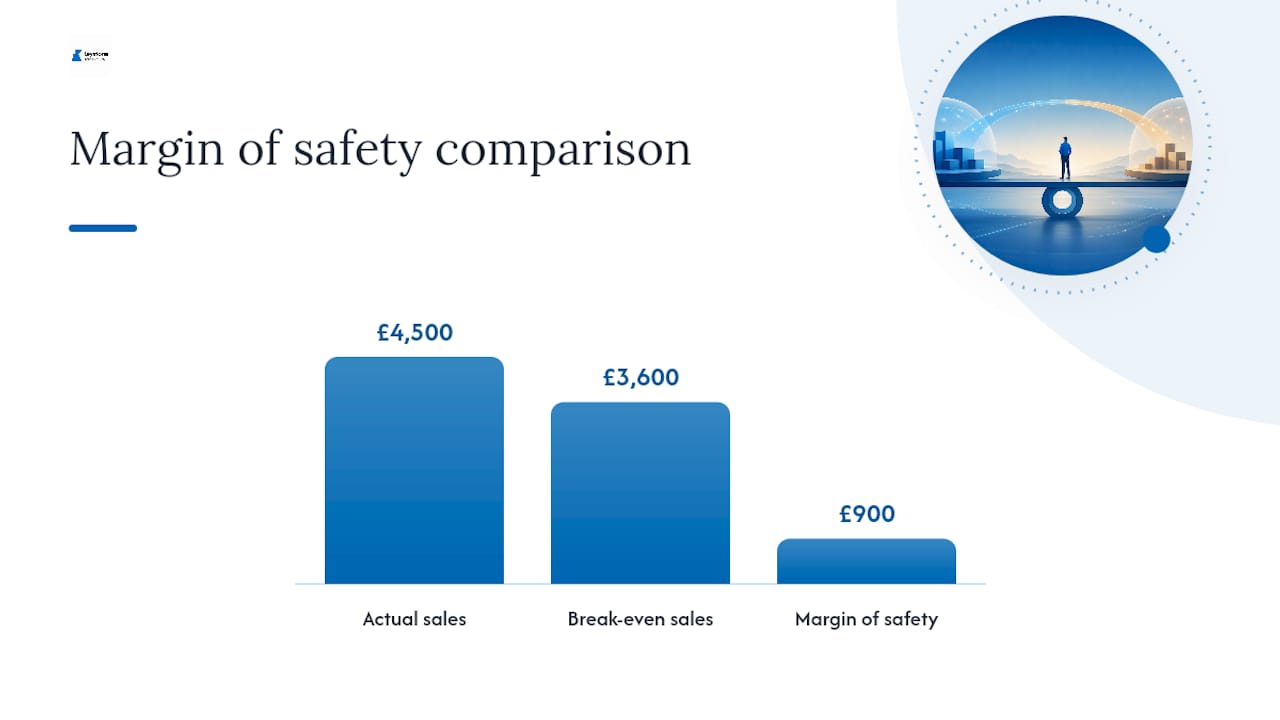
If the candle business forecasts £4,500 in monthly sales against a £3,600 break-even, that’s a £900 margin, or 20%. According to BBC Bitesize’s explainer, this is standard practice for visualising the relationship. A thin margin of safety means high operating leverage. Small drops in sales hit your bottom line hard, so it’s worth treating anything under 15 to 20% as a signal to build a cash buffer.
Using break-even results to make real decisions
BEP only earns its place in your planning if you actually use it to test decisions before you make them, not just calculate it once and file it away.
Test a price change. Raise the candle price from £18 to £20 and contribution margin jumps to £14. Break-even drops from 200 to 172 units, meaning you need to sell 28 fewer candles to cover the same fixed costs. Price is usually the fastest lever to move break-even, faster than cutting costs, because it flows straight through to contribution margin on every single sale.
Model a new fixed cost before you commit to it. Hiring a part-time assistant at £800 a month pushes fixed costs to £3,200, raising break-even to 267 candles. Run this calculation before signing any contract, not after.
Pair BEP with cash-flow, not instead of it. Break-even tells you when you’re profitable on paper; it says nothing about when the cash actually lands in your account. A business can be profitable on a break-even basis and still run out of cash waiting for invoices to clear, which is why startup finance guidance treats BEP and runway calculations as a pair, never a substitute for one another.
Bring sensitivity scenarios to investors. Lenders and investors want to see what happens if price drops 10% or variable costs rise 15%, not just the base case. Gov reinforces that transparent assumptions and scenario testing carry more weight than a single confident number.
Common mistakes that make your break-even number misleading
The most common error is blending one-off launch costs, like a new website build or opening-week marketing, into ongoing fixed costs. That inflates your break-even point and makes an otherwise healthy business look shaky on paper.
A close second is excluding owner pay entirely. It feels generous to leave yourself out of the sums, but it hides the real cost of running the business and understates what you actually need to charge.
The third trap is treating semi-variable or step costs as if they behave like pure fixed costs. Rent might jump if you outgrow your unit; a delivery contract might have a volume threshold that triggers a new tier. BEP is only valid inside that “relevant range”, and Capital One’s guidance on this is blunt: misclassify these and your BEP stops meaning anything.
Four fixes handle most of this:
Separate cost of goods sold from operating expenses in your chart of accounts
Flag semi-variable costs explicitly rather than lumping them into “fixed”
Include a realistic owner salary, even if you’re currently taking less
Re-run the whole model monthly, not once a year
KeystoneFA’s checklist for reliable break-even numbers
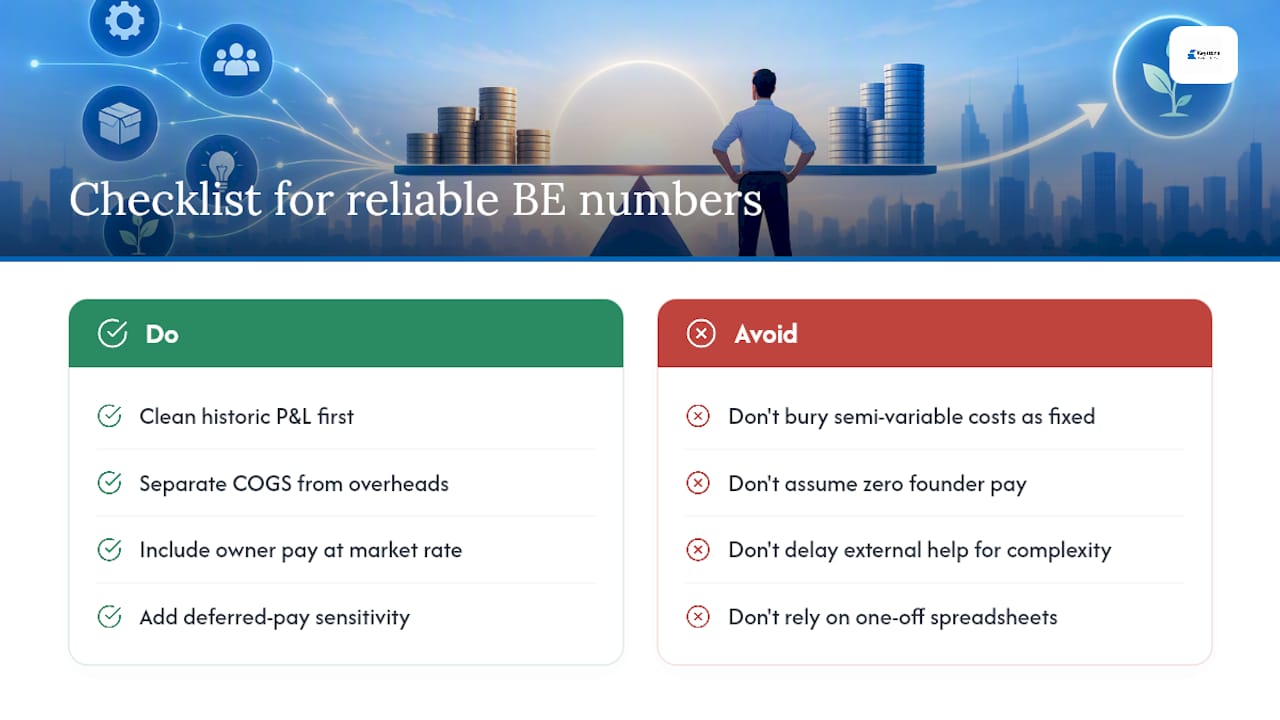
Getting break-even right starts with clean historic profit and loss data, not clever formulas. Before running any BEP model, KeystoneFA checks a client’s chart of accounts for the same issues covered above: cost of goods sold separated from overheads, owner pay included at a market rate, and semi-variable costs flagged rather than buried inside “fixed”.
For step costs, we typically run a baseline model with a market-rate founder salary, then layer in a deferred-pay sensitivity scenario so founders can see the real trade-off between take-home pay and runway. Sound accounting software setup makes this repeatable rather than a one-off exercise every time numbers get stale.
Bringing in outside help makes sense once your cost structure gets complicated (multiple products, step-cost suppliers, an outsourced finance function decision on the table) or once investors start asking for scenario modelling you don’t have time to build yourself.
What founders consistently get wrong about break-even
Most founders treat break-even as a number to hit once, then forget. That’s backwards. It’s a control metric you rerun monthly, always alongside a cash-flow check, because covering costs on paper and having cash in the bank are two different problems. The single habit worth building: every month, rerun BEP with two sensitivity checks, a price move and a variable cost shift, and prioritise improving contribution margin over cutting fixed costs, which tends to be the blunter and slower lever.
— Shoaib
Get your break-even numbers built properly
Running these formulas yourself gets you a rough number. Getting one you can actually defend to a lender, an investor, or your own decision-making takes clean bookkeeping behind it, which is where most DIY break-even models quietly fall apart.
[

](www.keystonefa.co.uk)
KeystoneFA’s Flexible Accounting Services That Grow With You start at £99 to £199 a month and cover the groundwork a reliable BEP depends on: day-to-day bookkeeping, accounts preparation and year-end reporting, and financial modelling built around your actual cost structure rather than estimates. A typical starter engagement includes a review of your current chart of accounts, separation of fixed and semi-variable costs, and a working break-even model you can update monthly yourself. If your business involves manufactured goods with supplier volume tiers, it’s also worth reading how outsourcing procurement decisions affects your variable cost assumptions. Visit KeystoneFA to request a starter engagement or ask about a break-even template built around your own figures.
Sources
For verification or templates, the FSB’s break-even guide covers the core UK small business case. Gov.uk’s business pages offer wider official guidance on financial planning, and Beancount.io’s contribution margin explainer is a solid independent deep dive on multi-product scenarios.
FAQ
What are the components of a break-even analysis?
A break-even analysis needs five inputs: fixed costs, variable cost per unit, selling price, contribution margin, and sales volume. From these you calculate contribution margin (selling price minus variable cost) and use it to find the units or revenue needed to cover fixed costs.
How do I calculate break-even in my business?
Divide your fixed costs by your contribution margin per unit to get break-even in units, or divide fixed costs by your contribution margin ratio to get break-even in revenue. The FSB’s worked method applies to both product and service businesses.
What counts as a good margin of safety?
There’s no single universal figure, but a margin of safety under 15 to 20% generally signals thin buffer and higher risk if sales dip. A higher percentage means more room between your actual sales and the point where you start losing money.
How do I build a break-even analysis in Excel?
Create input cells for fixed costs, selling price, and variable cost per unit, then use the formula fixed costs divided by (price minus variable cost) to get break-even units. Build a table of units sold against fixed costs, total costs, and revenue, then chart those three columns to see the break-even point visually. KeystoneFA can build this model around your actual figures as part of a starter engagement through KeystoneFA.
Recommended